[+/-]
If you encounter difficulties or problems with Connector/ODBC,
you should start by making a log file from the ODBC
Manager and Connector/ODBC. This is called
tracing, and is enabled through the ODBC
Manager. The procedure for this differs for Windows, Mac OS X
and Unix.
To enable the trace option on Windows:
-
The
Tracingtab of the ODBC Data Source Administrator dialog box enables you to configure the way ODBC function calls are traced.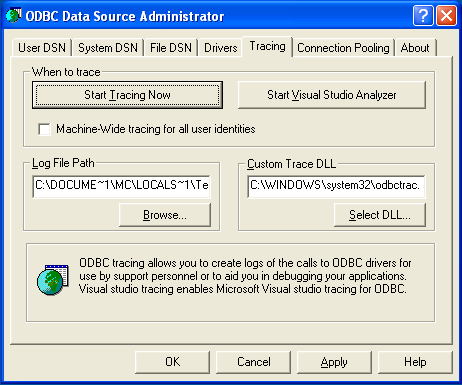
When you activate tracing from the
Tracingtab, theDriver Managerlogs all ODBC function calls for all subsequently run applications.ODBC function calls from applications running before tracing is activated are not logged. ODBC function calls are recorded in a log file you specify.
Tracing ceases only after you click
Stop Tracing
              Now
. Remember that while tracing is on, the log file continues to increase in size and that tracing affects the performance of all your ODBC applications.
To enable the trace option on Mac OS X 10.3 or later you
should use the Tracing tab within
ODBC Administrator .
Open the ODBC Administrator.
-
Select the
Tracingtab.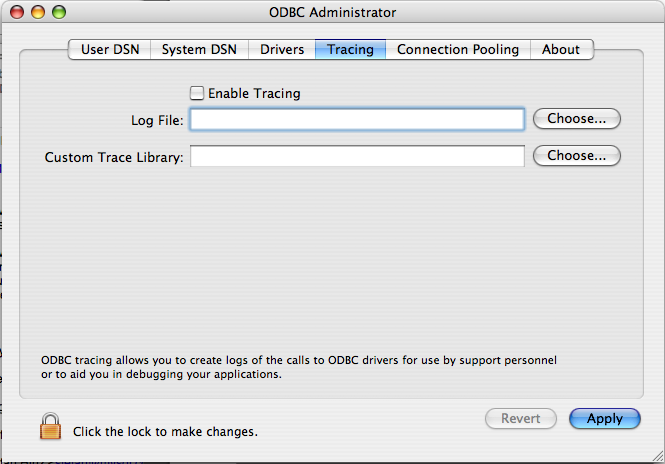
Select the
Enable Tracingcheckbox.Enter the location where you want to save the Tracing log. If you want to append information to an existing log file, click the button.
To enable the trace option on Mac OS X 10.2 (or earlier) or
Unix you must add the trace option to the
ODBC configuration:
-
On Unix, you need to explicitly set the
Traceoption in theODBC.INIfile.Set the tracing
ONorOFFby usingTraceFileandTraceparameters inodbc.inias shown below:TraceFile = /tmp/odbc.trace Trace = 1
TraceFilespecifies the name and full path of the trace file andTraceis set toONorOFF. You can also use1orYESforONand0orNOforOFF. If you are using ODBCConfig fromunixODBC, then follow the instructions for tracingunixODBCcalls at HOWTO-ODBCConfig.
To generate a Connector/ODBC log, do the following:
-
Within Windows, enable the
Trace
              Connector/ODBC
option flag in the Connector/ODBC connect/configure screen. The log is written to fileC:\myodbc.log. If the trace option is not remembered when you are going back to the above screen, it means that you are not using themyodbcd.dlldriver, see Section 20.1.4.3.3, “Errors and Debugging”.On Mac OS X, Unix, or if you are using DSN-Less connection, then you need to supply
OPTION=4in the connection string or set the corresponding keyword/value pair in the DSN. Start your application and try to get it to fail. Then check the Connector/ODBC trace file to find out what could be wrong.
If you need help determining what is wrong, see Section 20.1.8.1, “Connector/ODBC Community Support”.
User Comments
Add your own comment.